

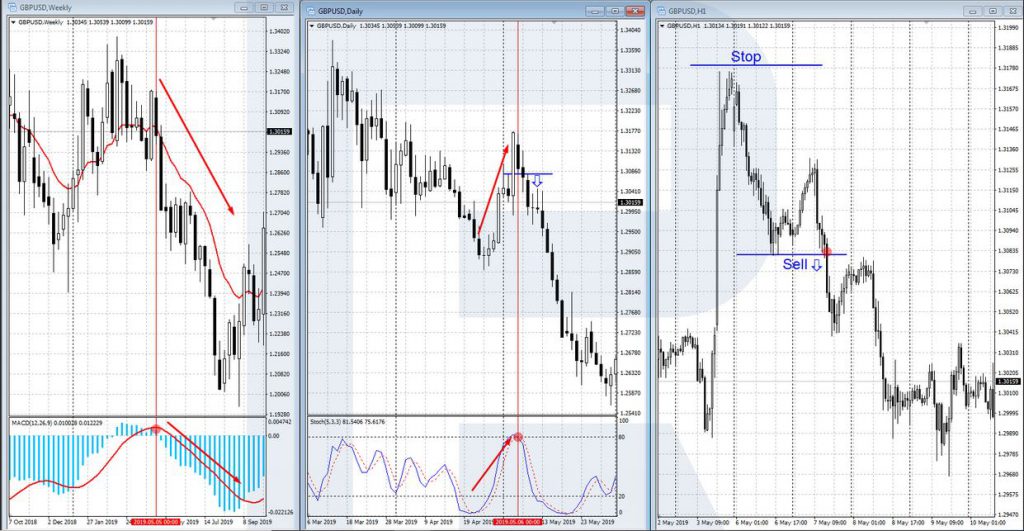
Triple Screen trading strategy
Instead of using a single trading indicator, the Triple Screen trading method applies several trading indicators. The goal is to filter out too many false signals as possible by using as many indicators as feasible.
Dr. Alexander Elder developed the method in 1985, and it was initially published in Futures Magazine in 1986.
What is the Triple Screen trading system?
The use of a single indicator, according to Dr. Elder, is incorrect. He proposed the idea that a single indicator would be unable to cope with the financial markets’ complexity.
There isn’t a single signal that can be called “perfect.” He went on to say that an indicator couldn’t operate in all timeframes and conditions.
Dr. Elder’s points can be explained in a variety of ways.
For example, when the market is heading upwards, trend indicators such as Moving Averages provide buy signals.
On the other hand, momentum oscillators, such as the Stochastics, show an overbought state, indicating a sell signal. When the market is in decline, the opposite is true.
Trend indicators work best when the market is trending, but they provide false signals when the market is ranging. Similarly, oscillators perform well for range markets, but they have problems when they move into a trend.
As a result, Dr. Elder created a trading method that combines the best trend and momentum indicators with the removal of basic averaging concerns.
How did the system get its name?
The name “Triple Screen” comes from the medical field. Since he was engaged with medical sciences, Dr. Elder named this Triple system Screen after the Triple Marker Screen Test.
Some individuals get the terms Triple Screen, and Three Screen mixed up. This is because the system uses three tests using trend and momentum indicators on every trade.
It’s important to address a problem with timeframes before choosing trend indicators for the system. On different timeframes, trend indicators can present different signals.
For example, on the 5-minute chart, an indicator may provide buy signals, whereas, on the daily chart, it can show sell signals.
A trader can solve this problem by dividing timeframes into five parts. There are 5 to 6 trading hours in day trading, for example. Each hour may be divided into five portions by a trader. Trend indicators would no longer generate contradictory indications in this manner.
How to use the Triple Screen trading system?
Trading with the trend is the best method to use the Triple Screen strategy. The system separates the trend’s period into three parts:
- – A tide refers to a long-term trend.
- – A wave is a term used to denote an intermediate-term trend.
- – Ripples are a phrase for short-term patterns.
The intermediate period is what the trader wants to strive for. Thus, one order above the intermediate is the longer period, while one below the intermediate is the shorter timeframe.
A trader would search for long-term patterns using trend indicators (by dividing timeframe into five segments). The indicators would then be applied to the intermediate timeframe.
These indicators would thus provide a trader with precise entry and exit positions, free of misleading signals.
Moving Averages and the MACD Histogram are the greatest trend indicators for the Triple trading technique.
Momentum oscillators can be used in range markets in the same way.
Bottom line
Dr. Elder created the Triple Screen trading system, which is a complex strategy. This strategy can be used in two ways: trading with the trend or trading against the trend.
CFDs are complex instruments and carry a high risk of rapid losses due to margin trading. Consider whether you understand how CFDs work and whether you can afford the risk of losing your money. This article is for educational purposes and is not investment advice.
Author: Andrew Trent
Andrew holds a degree in Data and Statistical Analysis and brings a tech nerd's curiosity to his writing. Off the clock, he's modeling data scenarios for fun, scuba diving, or taking underwater photos. He lives with his two Labradors, Homer and Duff, and his cat, Fibonacci.
Reviewed by: Chris Blakely
Content Editor with over two decades in financial journalism and a degree in Computer Engineering from the Polytechnic of the South Bank. Chris checks every article for factual accuracy and verifies claims before publication.
Last updated: November 24, 2021
Related Reading



Trader Sentiment
Share your outlook and see the results.
Bullish or bearish on EURUSD today?
Bullish or bearish on Bitcoin today?
Trending topics
FOREX HEATMAP
