

The Significance of Point and Figure Chart in Forex
Forex traders must know how to interpret charts if they are committed to actively trading stocks. Technical analysis relies heavily on charts. Price patterns can be identified more quickly using this visual representation. Additionally, charts help FX investors to get a clearer picture of price movement over time and make informed trading decisions.
Most traders rely on fundamental analysis tools to select stocks for trading but still use charts to figure out when to enter and exit a position. The purpose of this article is to provide you with an overview of PnF charts and highlight the benefits of incorporating them into your FX trading procedure.
What is a point and figure chart?
It is a method of charting in which only the value changes while the direction of change remains variable.
Trading and technical analysts often use it for forecasting future price movements as it has been around for more than 130 years.
Charles Dow, the first editor of The Wall Street Journal, was one of the earliest proponents of this method. Nonetheless, it has not been widely used since computers became more affordable for everyday traders.
However, traders can use this method to visualize how demand vs. supply compete based on price movements without a volume or time factor.
It does not include a volume or a time dimension. Graph paper is used to plot price data. If a reversal by at least one unit is recorded, a new column is automatically created.

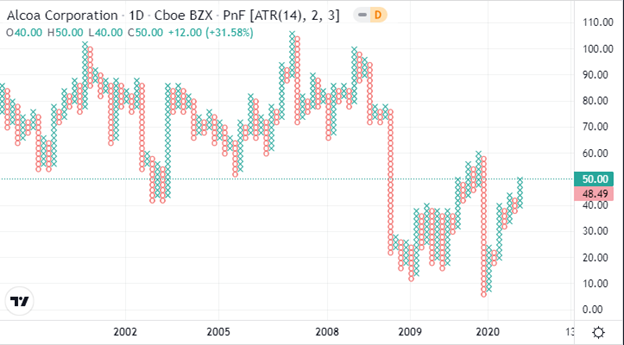
Figure: Point and Figure (PnF) Charting
A guide to analyzing point and figure charts
As discussed before, in a PnF chart, you can see how volatile a stock’s price has been and how much time has elapsed since the last point. This is because the y-axis measures only price units and is arithmetic. Thus, the y-axis represents the number of times stocks rose or fell to a particular extent, and the x-axis represents time intervals.
The box size specifies the amount to be used. In this case, it is the difference between marks on the y-axis.
In this chart, the X’s and O’s represent a determined amount of the price movement. Xs represent how often the stock has risen by the specified limit, whereas Os represents how many times it has fallen.
Plotting a zero indicates that the price sheds a whole unit of money (for example, $0.50). After a price changes direction and starts moving upward, an “X” is put into each box.

Figure: A chart showing point and figure data
By removing small price fluctuations, traders can focus on-trend quality.
Pros
- Buying and selling signals are easy to spot on breakouts and breakdowns.
- Traders do not buy or sell based on their mood or feelings and decide trading strategy based on these signals.
- Trendlines are not drawn arbitrarily on point and figure charts.
Cons
- The PnF chart doesn’t show gaps, so overnight gaps are not visible.
- The generation of a signal is dependent on the reversal method and the size of the box.
- Charts with PnF data do not show volume.
Bottom line
A PnF chart is one of the simplest methods for determining buy, entry, sell, or exit points. By using these charts, you can visualize price trends and movements in stocks regardless of how much time has passed. Furthermore, they are easy to use and interpret and are excellent for calculating price targets.
CFDs are complex instruments and carry a high risk of rapid losses due to margin trading. Consider whether you understand how CFDs work and whether you can afford the risk of losing your money. This article is for educational purposes and is not investment advice.
Author: Andrew Trent
Andrew holds a degree in Data and Statistical Analysis and brings a tech nerd's curiosity to his writing. Off the clock, he's modeling data scenarios for fun, scuba diving, or taking underwater photos. He lives with his two Labradors, Homer and Duff, and his cat, Fibonacci.
Reviewed by: Chris Blakely
Content Editor with over two decades in financial journalism and a degree in Computer Engineering from the Polytechnic of the South Bank. Chris checks every article for factual accuracy and verifies claims before publication.
Last updated: September 27, 2021
Related Reading

Trader Sentiment
Share your outlook and see the results.
Bullish or bearish on EURUSD today?
Bullish or bearish on Bitcoin today?
Trending topics
FOREX HEATMAP
