

The Most Important Things to Know About Forex Charts
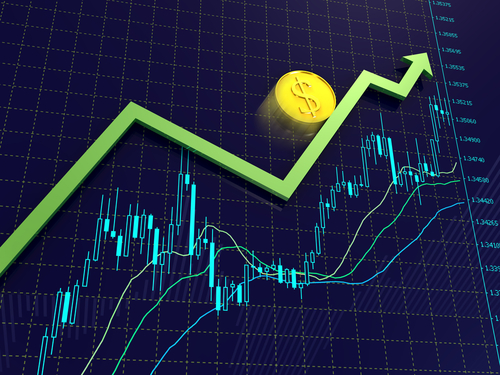
Forex charts are one of the most essential trading tools, since they display historical price data in a convenient visual format so that traders can find entry and exit points for trades. There are three major types of charts:
- Line charts: These forex charts track closing prices in order to see the general direction of price movements. Line charts are the simplest and most popular type of chart since they are easy to understand and use only closing exchange rates, since these are seen as the most important ones to monitor.
- Bar charts: These charts are more complex since they track a whole range of price data. The top of each individual bar indicates the highest price reached during the period monitored and the bottom the lowest price, while the whole bar displays the trading price range. Note that each bar represents a given period chosen by the trader when preparing the chart, whether it is one trading day, one week or even one hour. With more price data monitored, a bar chart offers more opportunities for detecting trends and spotting trading opportunities.
- Candlestick charts: These are similar to bar forex charts, but display the same data in a more visually appealing fashion. They are called candlestick charts because each bar features a wick on each end, which displays the highest and lowest price reached during trading. In addition, each bar is also given a color to indicate whether the opening price was lower than the closing price and vice versa. Candlestick charts are the type of chart you will most frequently encounter in forex sites, since they are easy to understand and interpret.


Here are some tips on how to read forex charts:
- If the price direction displayed on the chart is going up, it is a buying signal. On the other hand, if the direction is going down, it is a sell signal unless you are short-selling the currency, in which case it is a buying signal.
- Note that the prices being tracked on charts are bid prices, or the price a buyer is willing to pay. This is important to remember since when you buy a currency pair, you are paying the ask price or the price at which a seller is willing to sell it. The prices on the chart will not reflect what you will actually pay to your broker since you will actually be paying a spread on the quoted price.
- If you’re trading based on an upcoming economic announcement, take the time zones displayed at the bottom of the chart into account. Note that the time a particular piece of news is announced may be in Greenwich Mean Time (GMT), Eastern Standard Time (EST) or other time zones. Align the times on your charts with the time of the announcement so that you can track its effect on your charts.
- Be aware of the time frame displayed on forex charts since this can affect your analysis of price movements, based on the trading system that you are using.
CFDs are complex instruments and carry a high risk of rapid losses due to margin trading. Consider whether you understand how CFDs work and whether you can afford the risk of losing your money. This article is for educational purposes and is not investment advice.
Author: Andrew Trent
Andrew holds a degree in Data and Statistical Analysis and brings a tech nerd's curiosity to his writing. Off the clock, he's modeling data scenarios for fun, scuba diving, or taking underwater photos. He lives with his two Labradors, Homer and Duff, and his cat, Fibonacci.
Reviewed by: Chris Blakely
Content Editor with over two decades in financial journalism and a degree in Computer Engineering from the Polytechnic of the South Bank. Chris checks every article for factual accuracy and verifies claims before publication.
Last updated: September 6, 2012
Related Reading

Trader Sentiment
Share your outlook and see the results.
Bullish or bearish on EURUSD today?
Bullish or bearish on Bitcoin today?
Trending topics
FOREX HEATMAP
