

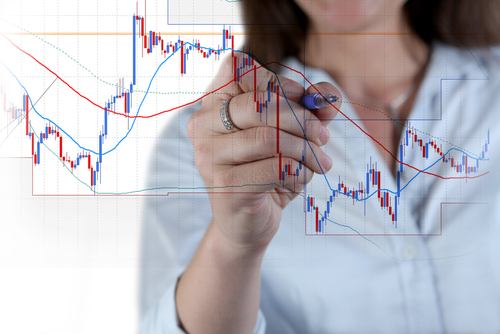
Quick Guide to Study Forex Charts and Time Frames like a pro
A forex chart shows how the exchange rate between two currencies has changed over time and how it has changed in the past. If you are new to the world of FX dealing, learning how to use these charts can help you learn more about how the markets work.
You can look at a forex chart for any currencies you want, such as EUR/USD (Euros to US Dollars), GBP/JPY (British pounds to Japanese yen), etc.
Forex market charts and time frames
The amount of time shown on a Forex chart will depend on your chosen time frame.
Many forex charts have a day as their default period, showing details about trades over a whole day. You can also choose between different periods, like minutes or months.
Reading complicated forex live charts and real-time trading charts will help you spot patterns and seize opportunities to make money.
How should someone read Forex charts?
The first thing you need to do is choose the type of chart you’ll be using. Trading sites usually offer three main types of charts: line charts, bar charts, and candlestick charts. Traders can use three different kinds of info to help them run their businesses.
On a line chart, each price at the end of the day is used to draw a line. A bar chart can show financial instruments’ opening and ending prices, as well as their highs and lows.
Well, a candlestick chart is similar to a bar chart, but it is much easier to see whether the market is optimistic or bearish. Now that you’ve picked the chart you like best, you can move on to the technical analysis.
When you use the LiteFinance platform, you can easily add different technical analysis tools to the chart, which makes it easy to decide whether to buy or sell a commodity.
How do I draw on a Forex chart?
Once you know what kind of chart works best for you, the next step is to draw the support and resistance lines to give you a general idea of how the market is doing. The first thing you need to do is figure out the highs and lows of the period you are looking at.
After that, you must join all the highs and lows you have already found by drawing lines between them. So, that’s it! You can move on now that you have good support and resistance levels.
Remember that the lines rarely line up perfectly, but you can still rely on them to show where the support and resistance zones are.
Conclusion
Many traders use different Forex price charts to accurately study the market and determine how people feel about it. First, you need to be clear about your Forex trading plan. Then, it would help if you chose the correct Forex trading chart.
CFDs are complex instruments and carry a high risk of rapid losses due to margin trading. Consider whether you understand how CFDs work and whether you can afford the risk of losing your money. This article is for educational purposes and is not investment advice.
Author: Andrew Trent
Andrew holds a degree in Data and Statistical Analysis and brings a tech nerd's curiosity to his writing. Off the clock, he's modeling data scenarios for fun, scuba diving, or taking underwater photos. He lives with his two Labradors, Homer and Duff, and his cat, Fibonacci.
Reviewed by: Chris Blakely
Content Editor with over two decades in financial journalism and a degree in Computer Engineering from the Polytechnic of the South Bank. Chris checks every article for factual accuracy and verifies claims before publication.
Last updated: July 5, 2023
Related Reading


Trader Sentiment
Share your outlook and see the results.
Bullish or bearish on EURUSD today?
Bullish or bearish on Bitcoin today?
Trending topics
FOREX HEATMAP
