

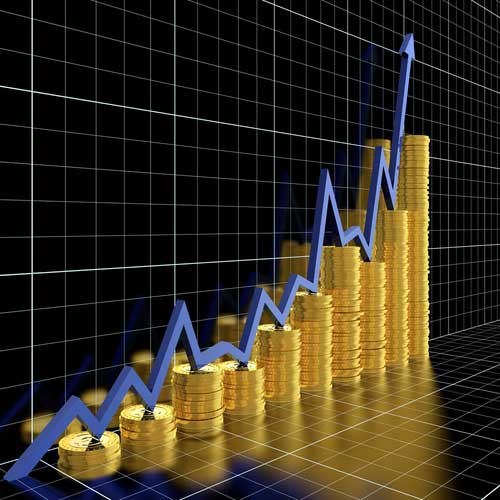
Importance of Forex Charts
Forex charts are a crucial tool for every trader regardless of whether they’re new to the market or not. Considering how volatile Forex is, charts are designed to add a bit more certainty to the whole process of buying or selling currencies. For those who are wondering exactly what these charts can do for them, following are the pros of this method.
Allows One-Glimpse Access to Information
Charts make it easier for traders to find out exactly what has happened in the market for the past few days, weeks or even months. When shown in a purely uncharted quantitative data, information like this can be very hard to decipher, often taking it longer for traders to make a decision. The charts however contain all the relevant information together in one image which can be understood with just a few minutes of study. This makes it perfect for non-fulltime traders or those who are just learning the trade.
Allows User to Track Trends
Forex charts are basically arranged chronologically, allowing traders to find out what happened within a specific period of weeks or months. Depending on how the chart is made, it can even provide historical data spanning a year or more. This makes it easier for user to track specific trends or patterns that might be repeating. For example, the month of August could be displaying an upward trend for the US dollar over and over again in a span of several years. From here, traders will be able to find out what is happening during this time and find out if the same will happen for their current year.
Paves the Way for Educated Guesses
As already mentioned above, the patterns will make it easier for traders to make educated guesses on how the next wave would go for the Foreign Exchange market. If the trend has shown that the US dollar experiences a boost in value during the second quarter every year, then chances are the current year will provide the same results. This kind of prediction allows the trader to position themselves in the market so that they will stand to gain something from the educated guess.



Figure Out Underlying Reasons
Another advantage of Forex charts is that it paves the way for further research to why specific changes are happening. In the example given a few notches up, the US dollar seems to spike up during the second quarter. This can lead traders to ask what specific event happens during the second quarter that can cause this much change in the market. Once the main root cause is figured out, it will be much easier for the trader to find out exactly what is going to happen even if the timing is off.
Of course, it’s important to note that Forex charts are only as good as the data used to plot them. This is why as much as possible; traders are advised to obtain their charts only from the most trustworthy providers. Ideally, a live Foreign Exchange chart will also be the best as it provides the most accurate
CFDs are complex instruments and carry a high risk of rapid losses due to margin trading. Consider whether you understand how CFDs work and whether you can afford the risk of losing your money. This article is for educational purposes and is not investment advice.
Author: Andrew Trent
Andrew holds a degree in Data and Statistical Analysis and brings a tech nerd's curiosity to his writing. Off the clock, he's modeling data scenarios for fun, scuba diving, or taking underwater photos. He lives with his two Labradors, Homer and Duff, and his cat, Fibonacci.
Reviewed by: Chris Blakely
Content Editor with over two decades in financial journalism and a degree in Computer Engineering from the Polytechnic of the South Bank. Chris checks every article for factual accuracy and verifies claims before publication.
Last updated: September 11, 2012
Related Reading

Trader Sentiment
Share your outlook and see the results.
Bullish or bearish on EURUSD today?
Bullish or bearish on Bitcoin today?
Trending topics
FOREX HEATMAP
