

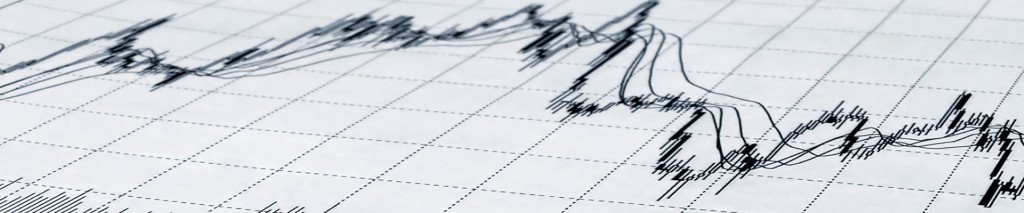
How can you Read Chart Seasonal Trading Patterns?
Trading patterns in the foreign exchange market are the breadcrumbs which investors follow for profitable trades. Price fluctuations are the primary source of profit and loss for those trading financial assets on the foreign exchange market.
Candlesticks are used to show the movement of a price over time. After 9 periods, a general trading chart will emerge from the candlestick patterns. The price history of a single underlying asset will be detailed in this graph.

During trading, what do chart patterns mean?
Technical analysis of raw price action can be performed with the help of Forex chart patterns, which are handy tools for traders. The trader can even pick up on the emotional undercurrents of the market.
Forex chart patterns allow investors to ride out market fluctuations. In addition, knowing how to recognize chart patterns can aid in selecting profitable trading opportunities with low risk.
How do you read patterns in a trading chart?
Where the chart patterns work is evident, but where they do not is more challenging to pin down. This is where most of the trouble starts.
You can save some heartache by ignoring the parts of the Forex chart where you think the pattern won’t work.
If you want to trade chart patterns like a pro, you need a comprehensive systematic technique that will allow you to understand chart patterns with ease.
Let’s talk about the simple actions you may take to start recognizing chart patterns like an expert. Three fundamentals can be used with every chart pattern:
- The first step is to evaluate chart patterns’ quality and magnitude in light of the surrounding price activity.
- Step two is to pinpoint where the chart pattern is. Locate the beginning of the new trend that contains the chart pattern. It’s also essential to locate critical levels of support and opposition.
- Third, calculate the probable profit margin. Following a profit margin is pointless because it provides a minimum risk ratio of 1:1.
Which chart is best for forex trading?
TradingView has the most helpful chart for foreign exchange trading. Multiple traders using the free version and the numerous advanced features highly suggest this chart.
Are chart patterns repetitive?
You’ll have access to valuable information once you understand the patterns visible in stock market charts. The same recurring phenomena keep occurring. Well, the most significant shift, however, is the low probability of an identical pattern repeat.
Can we use patterns in charts to forecast future prices?
Predicting the currency price with 100% accuracy using forex chart patterns is impossible. A common fallacy about technical analysis and chart patterns is that they can accurately anticipate future market behavior.

Bottom line
In conclusion, chart patterns are essential in accurately monitoring price fluctuations in the foreign exchange market. Traders can read market conditions and establish support and resistance levels by analyzing chart patterns. Also, it helps you anticipate potential shifts in the foreign exchange market and capitalize on emerging trading chances.
CFDs are complex instruments and carry a high risk of rapid losses due to margin trading. Consider whether you understand how CFDs work and whether you can afford the risk of losing your money. This article is for educational purposes and is not investment advice.
Author: Andrew Trent
Andrew holds a degree in Data and Statistical Analysis and brings a tech nerd's curiosity to his writing. Off the clock, he's modeling data scenarios for fun, scuba diving, or taking underwater photos. He lives with his two Labradors, Homer and Duff, and his cat, Fibonacci.
Reviewed by: Chris Blakely
Content Editor with over two decades in financial journalism and a degree in Computer Engineering from the Polytechnic of the South Bank. Chris checks every article for factual accuracy and verifies claims before publication.
Last updated: June 6, 2023
Related Reading

Trader Sentiment
Share your outlook and see the results.
Bullish or bearish on EURUSD today?
Bullish or bearish on Bitcoin today?
Trending topics
FOREX HEATMAP
