


Doji Candlestick Pattern Recognition
There is no surprise that the candlestick patterns are known to any trader working in this business.
As a trader, even if you do not use candlestick analysis, you must at least know how to identify it on the charts and benefit from them. Unfortunately, it is a highly taxing job for most traders to memorize all the formations to detect the candlestick on the chart correctly.
Identifying Candlesticks
There is good news for traders, and that is that they only need to recognize the relevant formations and not all of them. These are the ones that are considered to be the most reliable. Therefore, it will increase the chances of correctly identifying the entry points.
This article will also introduce you to the Doji candlestick, their types, and different variations in the bullish and bearish patterns.
How to interpret a Doji pattern?
If you cannot detect a Doji pattern on a chart, then you might as well not even be in the business. Yes, it is that crucial to know. It is pretty hard to miss a candle on a chart since you cannot miss it because of its peculiar appearance. The closing and opening prices of it are usually equal. Even if it is short, a Doji with a body is considered an imperfect pattern in the trading business. There are several types of Doji candles. However, you do not need to learn all of the. Simply learn recognizing the Doji candles with a long wick and proximity of the open and close prices.
A Doji candle usually has two long wicks, which are tails in the common language. Therefore, to figure out what is exactly going on in the market, you must pay attention to the candle’s body, if it has one, and its wicks. This way, you will be able to identify the market situation accurately.
Bears and Bulls
If a Doji candle has no body, there is a strong balance between the bears and bulls.
If a candle has a small body, it will indicate that bulls or bears take over the market. But if the body is too short, we cannot establish any dominance. So, the trader must then look at the wicks.
If the wick is medium or large, this indicates significant price fluctuations. A short wick will suggest that the price is moving within a narrow range if the wicks are the same size, power balance between the bears and bulls. If you come across wicks of different sizes, this will indicate a failed attempt of pushing a price in the direction of the long wick.
Bottom line
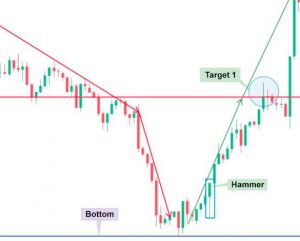
As a trader, you must keep a close eye and learn how to identify candlesticks and wicks; it is crucial to the trading world. For example, a Doji candle is a highly effective reversal signal for forex traders. However, do not forget the importance of money management in trading.
CFDs are complex instruments and carry a high risk of rapid losses due to margin trading. Consider whether you understand how CFDs work and whether you can afford the risk of losing your money. This article is for educational purposes and is not investment advice.
Author: Andrew Trent
Andrew holds a degree in Data and Statistical Analysis and brings a tech nerd's curiosity to his writing. Off the clock, he's modeling data scenarios for fun, scuba diving, or taking underwater photos. He lives with his two Labradors, Homer and Duff, and his cat, Fibonacci.
Reviewed by: Chris Blakely
Content Editor with over two decades in financial journalism and a degree in Computer Engineering from the Polytechnic of the South Bank. Chris checks every article for factual accuracy and verifies claims before publication.
Last updated: July 14, 2021
Related Reading


Trader Sentiment
Share your outlook and see the results.
Bullish or bearish on EURUSD today?
Bullish or bearish on Bitcoin today?
Trending topics
FOREX HEATMAP
