

How to Use a Moving Average for Buying Stocks Successfully?
The moving average (MA) is a simple way to analyze the forex market. It gives a constantly updated average price, which makes price information less volatile.
The user can choose the average time to figure out the average, which could be from 10 days to 30 weeks.

Moving average techniques are popular and can be changed to work with almost any data set. Because of this, they are good for both long-term buyers and day traders who want to buy and sell stocks quickly.
How does moving average help?
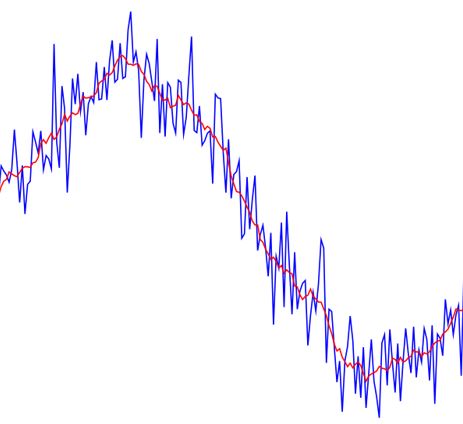
By using a moving average, price changes can be smoothed out. The price can be predicted by looking at the direction of the moving average.
If the indicator is slanted to the right, the price is going up or has been going up lately. And if it tilts lower, prices go down. But, if the price changes only slightly, it will likely be in a range.
A moving average can also be used as support or resistance. The 50-day, 100-day, or 200-day moving average can offer support during a trend.
Length of moving average
Most moving averages have a length of between 10 and 200. Traders can use these periods with any time frame chart (one minute, daily, weekly, etc.) that fits their needs.
How well a moving average works depends greatly on the “look back period,” or length of time, you choose.
When prices change, an MA with a shorter time frame will respond faster than one with a longer look-back period. For example, 20-day moving average is a better predictor of price changes than the 100-day moving average.
Do moving averages have any drawbacks?
Moving averages are based on information/data from the past. Thus, moving averages can give results that are hard to predict. The market does not always consider MA support/resistance and trade signs.
Price activity that is all over the place is a big problem because it can lead to multiple trend reversals or trade signals. This warning sign is that it’s time to move away or switch to a different signal.
Moving average crossovers can also lead to multiple failed deals if the moving averages get “tangled up” over a long period.
Thus, moving averages are less useful when the market is volatile or changing than when there is a clear direction.
Changing the time frame can help for a little while. But the problem likely returns at some point, regardless of the time frame chosen for the moving average(s).

Bottom line
A moving average makes the data easier to understand by combining several price points into one continuous line. It’s so easy to see the trend.
Simple moving averages take longer to show price changes than exponential moving averages. This could be good in some situations, but it could send the wrong message in others.
CFDs are complex instruments and carry a high risk of rapid losses due to margin trading. Consider whether you understand how CFDs work and whether you can afford the risk of losing your money. This article is for educational purposes and is not investment advice.
Author: Andrew Trent
Andrew holds a degree in Data and Statistical Analysis and brings a tech nerd's curiosity to his writing. Off the clock, he's modeling data scenarios for fun, scuba diving, or taking underwater photos. He lives with his two Labradors, Homer and Duff, and his cat, Fibonacci.
Reviewed by: Chris Blakely
Content Editor with over two decades in financial journalism and a degree in Computer Engineering from the Polytechnic of the South Bank. Chris checks every article for factual accuracy and verifies claims before publication.
Last updated: April 29, 2023
Related Reading



Trader Sentiment
Share your outlook and see the results.
Bullish or bearish on EURUSD today?
Bullish or bearish on Bitcoin today?
Trending topics
FOREX HEATMAP
