

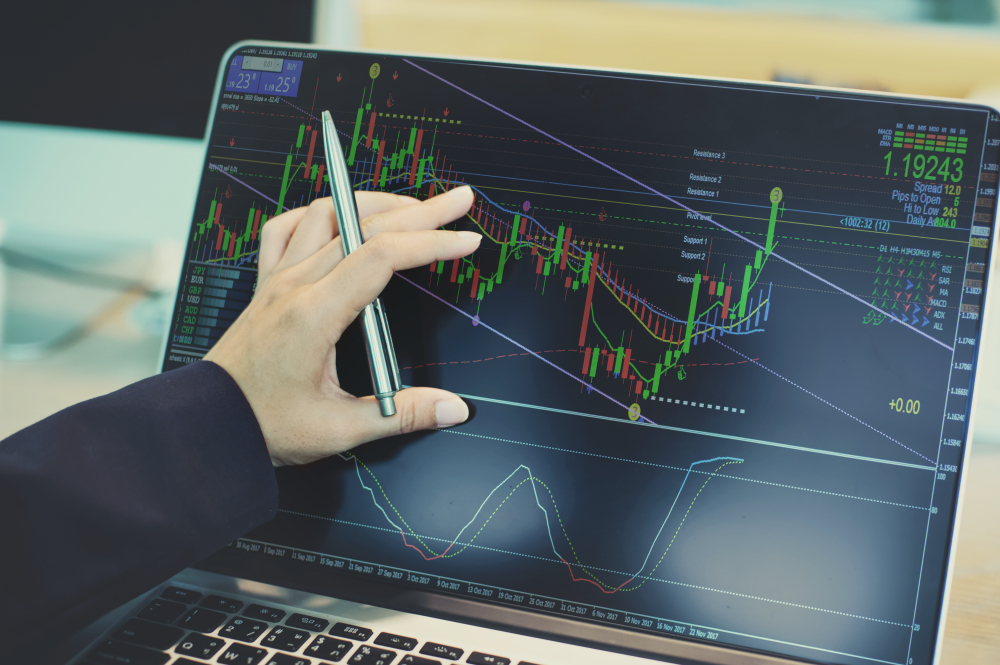
Top 3 Technical Indicators For Forex
A forex trader considers indicators crucial when making decisions. They help them understand when the foreign exchange market is an excellent time to buy or sell, which helps them make informed trading decisions.
It is a well-known fact that these indicators play a crucial role in technical analysis, and every technical analyst or fundamental analyst should be familiar with them. In the following list, you will find the three most essential forex indicators:

Moving verage convergence divergence (MACD)
The Moving Average Convergence Divergence (MACD) indicator, set at 12, 26, 9, is an excellent tool for novice traders who wish to analyze rapid price fluctuations. Using this classical momentum tool, you can determine how fast a particular market is moving while trying to pinpoint natural turning points.
The histogram must pass through the zero line after reaching a peak to trigger a buy or sell signal. The height and depth of the histograms, the speed of change, and the number of items change all interact to provide market data.
Over the past five months, SPY has displayed four MACD signals. While the first signal signals fading momentum, the second captures directional thrust immediately after the signal is triggered.
Although the third signal appears misleading, it accurately predicts the end of the February-March buying impulse. A whipsaw occurs when the histogram fails to surpass the zero line in the fourth case.
On balance volume (OBV)
You can view volume histograms under your price bars to determine a particular security level of interest. As participation slopes over time, new trends often emerge-often before price patterns have completed breakouts or breakdowns.
The current session can also be compared to a 50-day average volume to see how it compares with the historical data.
Add on-balance volume (OBV), an accumulation-distribution metric for a complete snapshot of transaction flow. With the indicator, buyers and sellers add their activity to determine whether bears or bulls are winning the battle.
On OBV, trendlines and highs and lows can be drawn. This is ideal for determining convergence and divergence. The Bank of America (BAC) example illustrated this when prices ranged higher, but OBV ranged lower between January and April, signaling a bearish divergence before a steep decline.
Average directional movement index (ADX)
ADX Indicator is a Forex technical indicator created from the directional indicator +DI and -DI to illustrate the strength of a trend. Directional Movements (Directional Movements) are calculated by comparing the current day’s closing prices to the previous day’s closing prices.
After combining these figures, they are divided by the true average range (ATR), which we will discuss further in this article.
A +DI compares today’s strength of the bull to yesterday’s, while a -DI highlights today’s strength of the bear versus yesterday’s. ADX is a method of telling whether the bear or the bull is more muscular today based on the value of +DI and -DI.
The indicator consists of three lines; the ADX itself (solid green line), the +DI (dotted blue line), and the -DI (dotted red line), which are all based on a scale from 0 to 100. An ADX value below 20 signals a weak trend (bullish or bearish).
At 40, a trend is visible, and at 50, there is a strong trend. The bull overpowers the bear if the +DI is above the -DI. As well as the angle of the lines, which shows the rate of change, there is value in the incline.

Bottom line
The process of choosing the right technical indicators can be overwhelming. Still, novice traders can achieve success by dividing the effects into five categories: trend, mean reversion, relative strength, momentum, and volume. The next step is adjusting inputs to match their trading style and risk tolerance after adding effective indicators for each category.
CFDs are complex instruments and carry a high risk of rapid losses due to margin trading. Consider whether you understand how CFDs work and whether you can afford the risk of losing your money. This article is for educational purposes and is not investment advice.
Author: Andrew Trent
Andrew holds a degree in Data and Statistical Analysis and brings a tech nerd's curiosity to his writing. Off the clock, he's modeling data scenarios for fun, scuba diving, or taking underwater photos. He lives with his two Labradors, Homer and Duff, and his cat, Fibonacci.
Reviewed by: Chris Blakely
Content Editor with over two decades in financial journalism and a degree in Computer Engineering from the Polytechnic of the South Bank. Chris checks every article for factual accuracy and verifies claims before publication.
Last updated: June 13, 2022
Related Reading

Trader Sentiment
Share your outlook and see the results.
Bullish or bearish on EURUSD today?
Bullish or bearish on Bitcoin today?
Trending topics
FOREX HEATMAP
