

The daily high/low trading strategy: Is it worth it?
The daily high low technique is a breakout strategy based on the highs and lows of the daily chart. Forex investors rely heavily on the daily timeframe, as most significant market investors use it to plan their investments.
So, we can say that any strategy utilizing the daily timeframe generates better results than a strategy utilizing a lower time frame. In contrast, a rally that breaks the ups and downs of the daily time frame indicates strong market momentum.
As long as you stay away from the range market, you can get reliable financial results using the high low-based strategy. It is possible to profit from this trading strategy if you execute it according to the following rule.

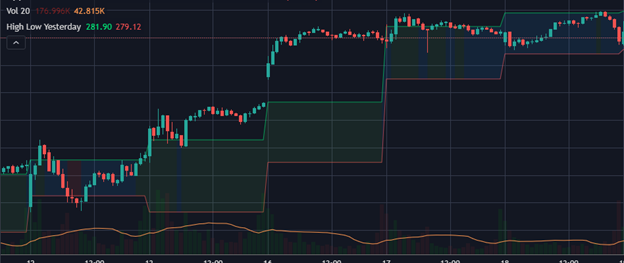
High/Low trade charting-source: tradingview
Let’s look at how to invest in the high/low strategy to make a profit with an example.
High Low Breakout Trading Technique: What is it?
In this trading strategy, you can determine most of your investment decisions a day before the expected move. You can place two pending orders either above or below yesterday’s candle. This allows you to keep track of any upward or downward movements from the previous day’s candle.
Time Frame: When determining highs and lows, consider the daily timeframe. When you’re ready to enter the transaction, move to the lower timeframe (usually H4). However, new traders may want to consider sticking to the daily timeframe.
Currency to use: The strategy applies to all currency pairs, including EURUSD, GBPUSD, USDJPY, and AUDUSD. However, a better overall result can be obtained by sticking to the major and minor currency pairs. Further, exotic pairs should be avoided since hitting the low or high and reverse back would be a false move.
For example
Here’s a graphical representation of the trading strategy based on daily high-low prices:

A visual representation of high/low breakout strategy
- With the price moving up from the support level, we can see that the price closed above this level every day. Once the price closes above the critical support level daily, a buy stop is taken. A bearish market will follow a similar pattern when the price closes daily from a significant resistance level.
- After taking the buy stop, the price moved up to the take profit level the next day. In the daily chart, the average price of the last three candles is used to determine the take profit level.
- In the example, the stop loss is set at 50% of the previous day’s candle. The price may reverse or consolidate more if the stop loss is hit. If that happens, we should wait for another breakout or switch currencies.
Tips to consider while trading high/low strategy
Here are a few tips for the daily breakout strategy:
- Find the currency pair that will move within a trend or start a new trend.
- If a candle is rising from a support level, place a buy stop above it, and if it is falling from a resistance level, place a sell stop.
- Stop-loss should be at 50% of yesterday’s candlestick.
- You will take profit based on the average price of the past three days.
Bottom line
Trading this strategy requires avoiding market choppy conditions and corrections. To determine possible movements, you should use the price action by measuring the price momentum. Moreover, follow a strict money management strategy to maximize the benefit of this strategy.
CFDs are complex instruments and carry a high risk of rapid losses due to margin trading. Consider whether you understand how CFDs work and whether you can afford the risk of losing your money. This article is for educational purposes and is not investment advice.
Author: Andrew Trent
Andrew holds a degree in Data and Statistical Analysis and brings a tech nerd's curiosity to his writing. Off the clock, he's modeling data scenarios for fun, scuba diving, or taking underwater photos. He lives with his two Labradors, Homer and Duff, and his cat, Fibonacci.
Reviewed by: Chris Blakely
Content Editor with over two decades in financial journalism and a degree in Computer Engineering from the Polytechnic of the South Bank. Chris checks every article for factual accuracy and verifies claims before publication.
Last updated: September 28, 2021
Related Reading



Trader Sentiment
Share your outlook and see the results.
Bullish or bearish on EURUSD today?
Bullish or bearish on Bitcoin today?
Trending topics
FOREX HEATMAP
