

How to Use the Elliot Wave Theory
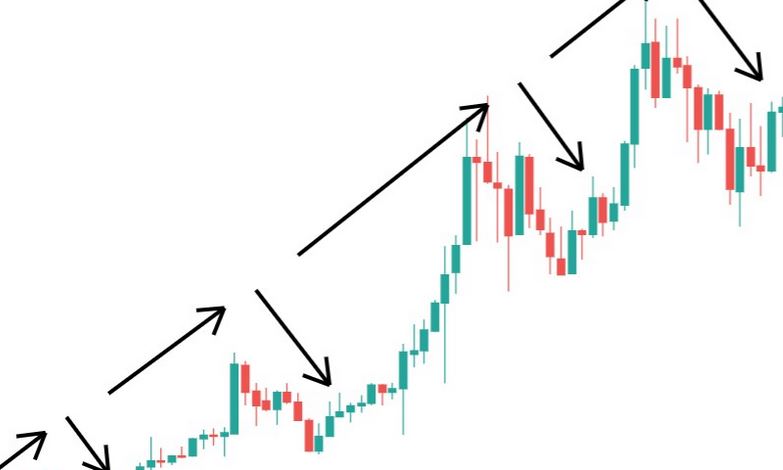
The Elliot Wave is a popular method of analyzing the forex markets to identify trading opportunities. It is based on the theory that the markets would reflect nature and prices would move in a five wave pattern. Of these, the first, third and fifth would be upwaves, which are separated by downwaves (waves two and four). In turn, this five-wave up movement would be followed by a down movement consisting of three downwaves and two upwaves.
In addition, the two downwaves (waves two and four) would also have smaller downwaves as the price of the security will partially retrace. These smaller waves are labeled alphabetically, with A and C being the downwaves and B being the upwave. These waves are considered corrective waves and there are three basic formations to look for: triangles, flats and zigzags.
The main problem with the Elliott Wave theory is that, despite its technical nature, it is still subject to subjective analysis. This means that two practitioners can look at the same price chart and come up with different wave counts. Thus, if you are planning to use this method of analysis, it is very important that you decide in advance which method of generating a wave count to use. Fortunately, there are software available for this purpose and you should just choose the one you feel most comfortable with.
The next step is to identify the fifth wave since this is confirmation that there is a price trend. Once this has happened, you should immediately confirm the trend using other technical indicators. For example, you can use the Commodity Channel Index or the relative strength index. These will also provide you with trading signals as to when you should open a long trade. For example, if the 90-day CCI is greater than zero and if the three-day RSI reverses direction and moves upward, then you should initiate a trade. To illustrate how you can use Elliott Wave analysis on the GBP/USD currency pair, start by identifying support and resistance levels. You can then look for Elliott Waves within this range. Once you have identified the corrective waves, you can enter a trade. Don’t forget to set take-profit and stop-loss orders based on your risk-reward ratio and always have an exit plan. You can also take some profits once the price moves in your direction and then set a trailing stop for the remainder of the position.
CFDs are complex instruments and carry a high risk of rapid losses due to margin trading. Consider whether you understand how CFDs work and whether you can afford the risk of losing your money. This article is for educational purposes and is not investment advice.
Author: Andrew Trent
Andrew holds a degree in Data and Statistical Analysis and brings a tech nerd's curiosity to his writing. Off the clock, he's modeling data scenarios for fun, scuba diving, or taking underwater photos. He lives with his two Labradors, Homer and Duff, and his cat, Fibonacci.
Reviewed by: Chris Blakely
Content Editor with over two decades in financial journalism and a degree in Computer Engineering from the Polytechnic of the South Bank. Chris checks every article for factual accuracy and verifies claims before publication.
Last updated: June 28, 2021
Related Reading


Trader Sentiment
Share your outlook and see the results.
Bullish or bearish on EURUSD today?
Bullish or bearish on Bitcoin today?
Trending topics
FOREX HEATMAP
